Dashboard
The Dashboard at /<workspace>/dashboard is the first screen you land on after logging in. It pulls together your most important numbers, recent results, and shortcuts so you can see how your accounts are doing and decide what to do next.
Why use this?
- Get a single, glanceable view of your performance without digging through each platform.
- Spot what's working — top posts and audience trends — at a glance.
- Jump straight into your most common tasks with one click.
How it works
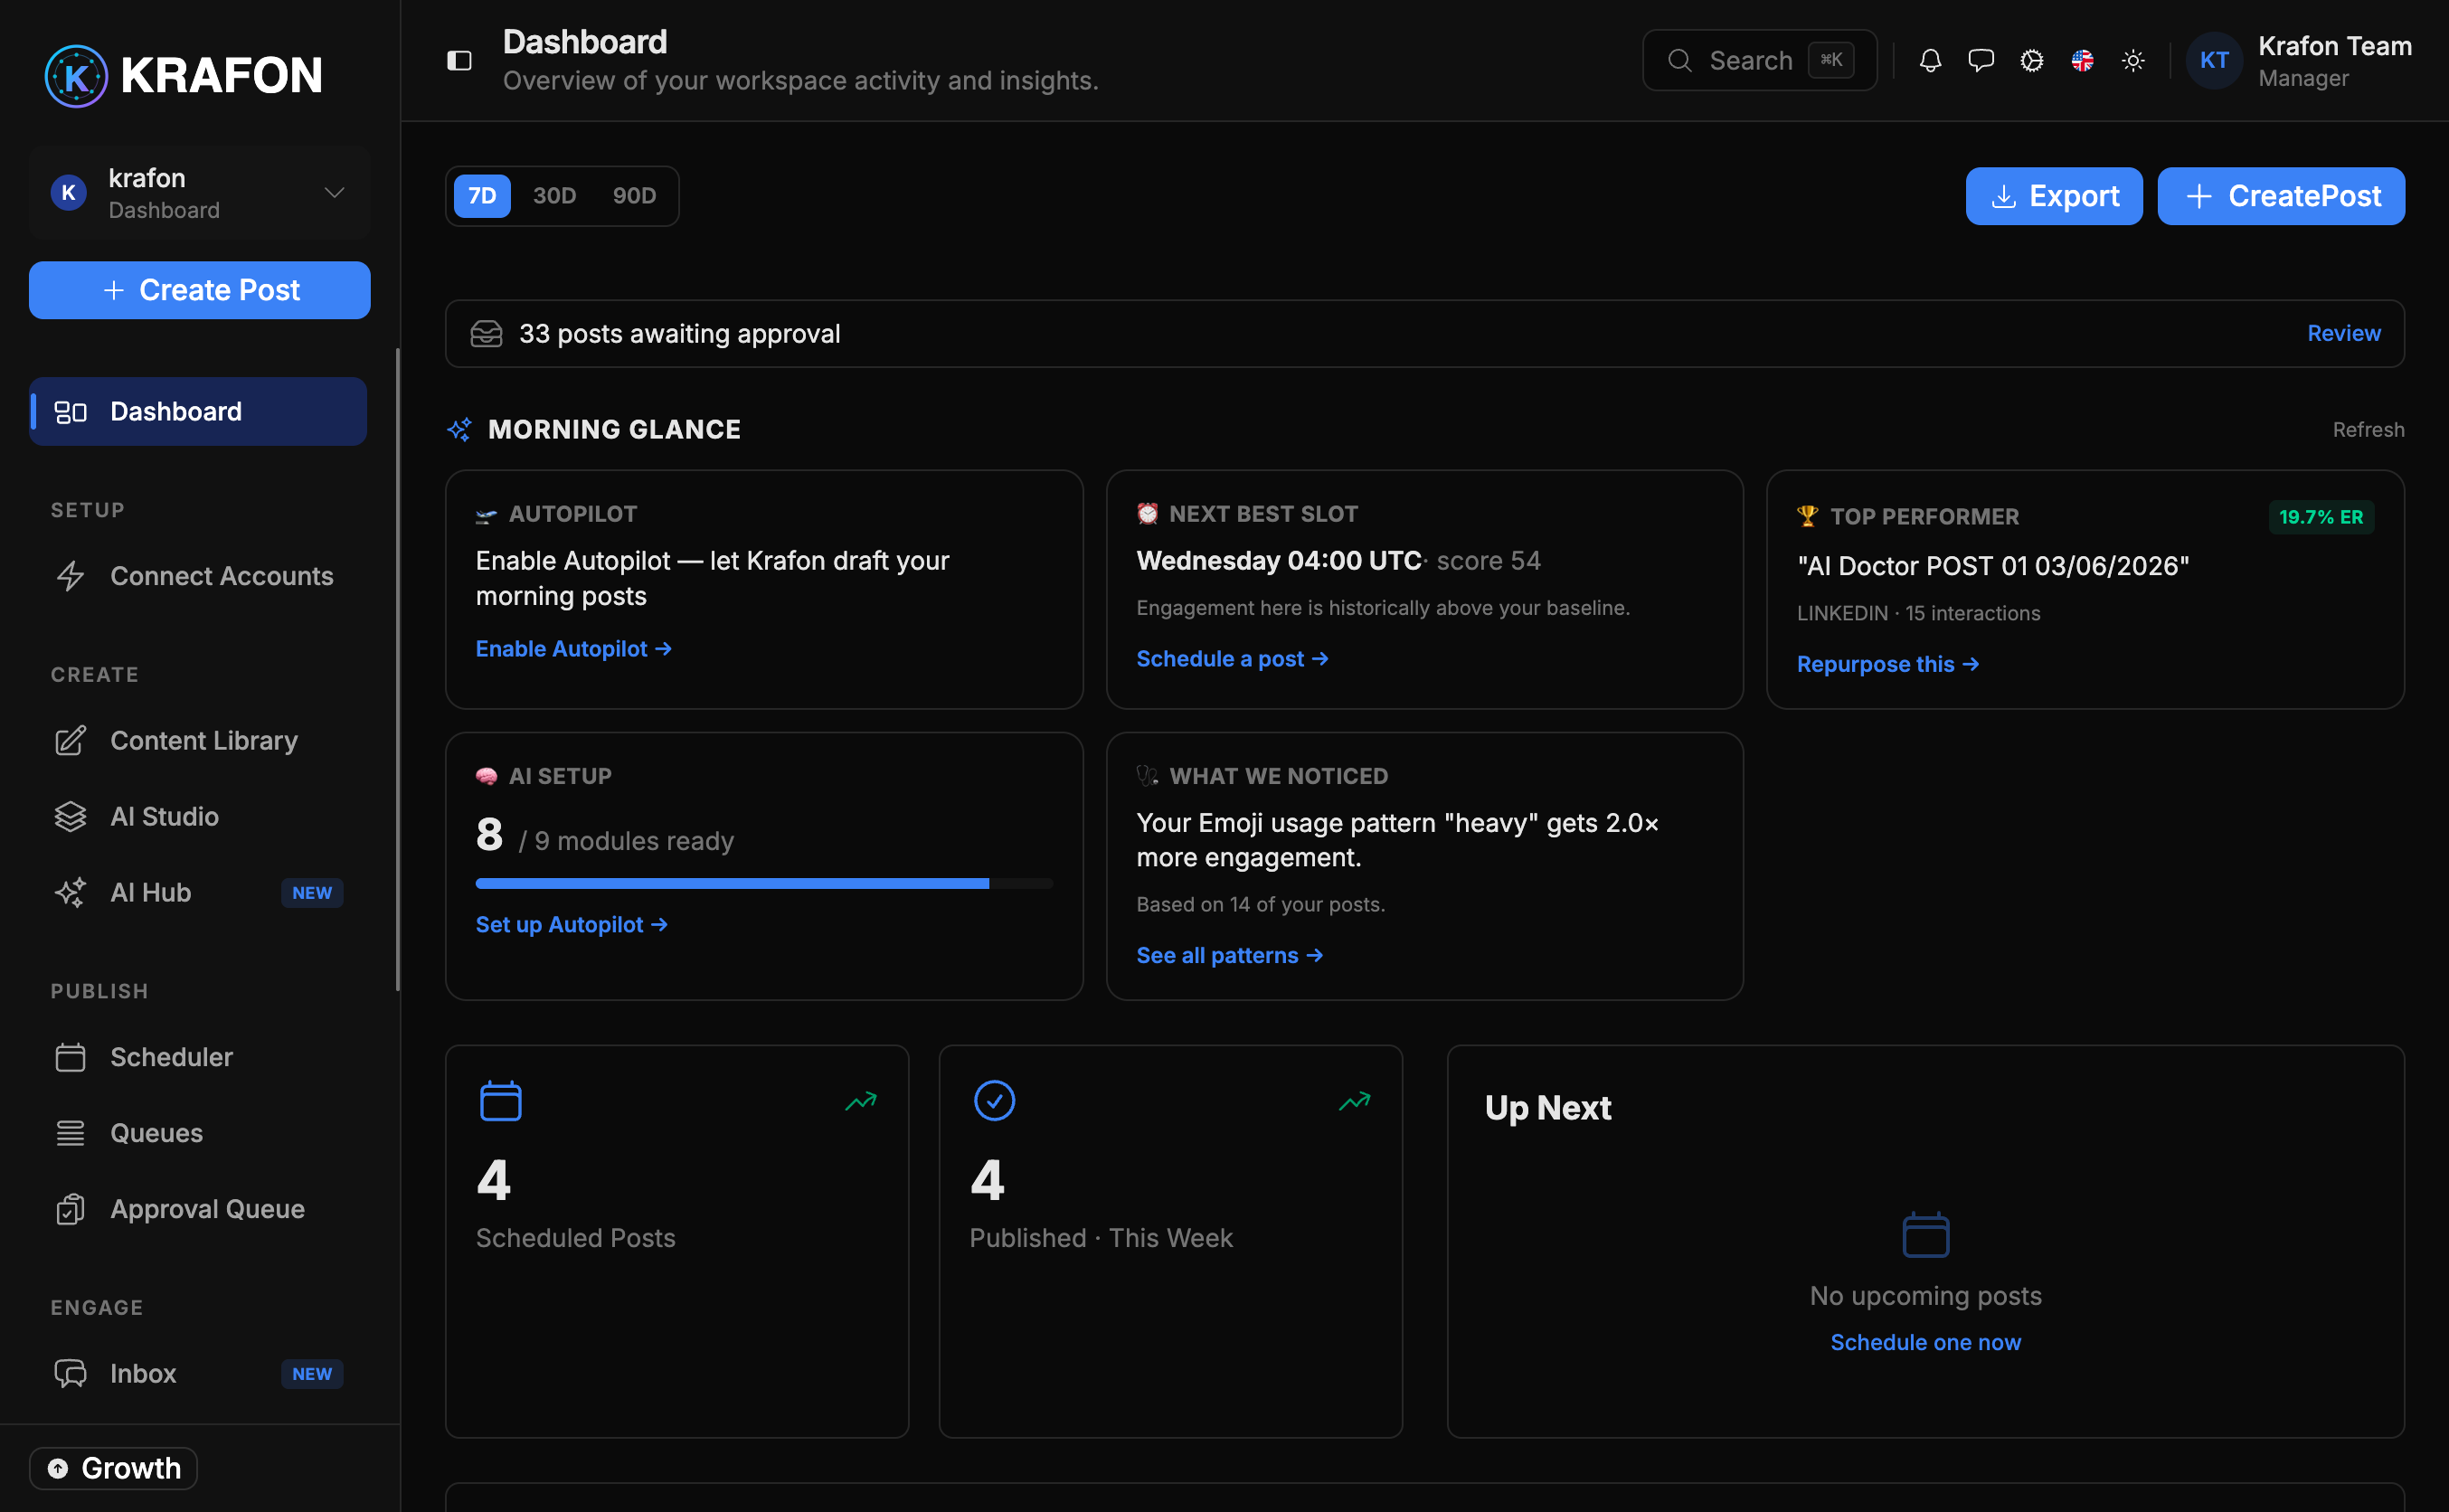
- Open the Dashboard. It loads automatically after login, or select Dashboard in the sidebar.
- Read your KPI cards. Cards at the top summarize key metrics such as scheduled posts and engagement trends.
- Check audience growth. The audience-growth visualization shows how your follower base is trending over the selected period.
- Review top-performing content. See which recent posts earned the most engagement.
- Scan the posted calendar. A calendar view shows what has already gone out, so you can see your cadence.
- Use the draft quick-view. Pick up where you left off with quick access to your latest drafts.
- Act from the action panel. Quick CTAs let you create a post, schedule content, or open other tools without leaving the page.
- Adjust the date range. Use the 7D / 30D / 90D filters to change the window for your KPIs and charts.
If you haven't connected a social account yet, the Dashboard shows a guided empty state instead of full analytics. Follow the steps to finish setup — see Onboarding.
Example workflow
It's Monday morning. You open Krafon and the Dashboard greets you. You set the range to 7D, notice engagement dipped over the weekend, and see one Reel outperformed everything else. You open the draft quick-view, finish a similar post you'd started, and use the action panel's Schedule CTA to slot it for Tuesday — all in under two minutes.
Tips
Switch to 90D before planning a new campaign to spot longer-term audience trends that a 7-day view can hide.
For a deeper breakdown of any metric — reach, engagement rate, best times — open Analytics.
Common issues
Problem: The Dashboard shows an empty state with setup steps instead of charts. Solution: You haven't connected an account yet. Follow Onboarding to connect at least one profile; analytics appear once data starts flowing in.
Problem: KPI numbers look lower than expected. Solution: Check the date-range filter. A 7D view only counts the last week — switch to 30D or 90D for a fuller picture.
Problem: A recently published post isn't on the posted calendar yet. Solution: Platform data can take a short while to sync. Refresh after a few minutes; if it still doesn't appear, confirm the post actually published from your Content Library.
FAQ
Can I change which KPIs appear? The Dashboard surfaces a curated set of core metrics. For custom analysis, use Analytics.
Does the date range affect every section? Yes — the 7D / 30D / 90D filter updates the KPI cards and trend visualizations together.